Note
Click here to download the full example code
Rebin and clean a spectrum
import matplotlib.pyplot as plt
from cana.datasets import getspectrum
# First load an spectrum, we will just gonna use one from the available datasets.
# you can do: spec = cana.loadspec('path to your spectrum file')
spec = getspectrum('000752b', ref='primass')
# creating subplots 0-2
fig, ax = plt.subplots(1,3, figsize=(15,5), sharey=True)
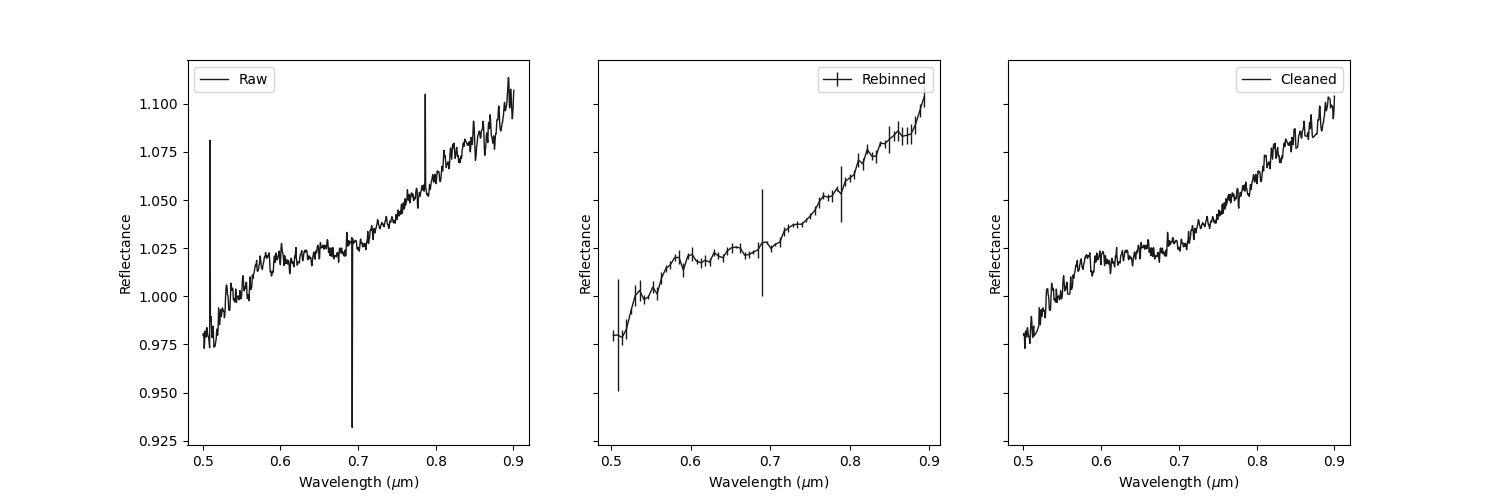
# Raw data
spec.plot(fax=ax[0], speckwargs={'label':'Raw'})
# Rebining spectrum
# rebin Defaults: binsize=11, method='median', std=True, rem_trend=False
spec_rebin = spec.rebin()
# Rebined data
spec_rebin.plot(fax=ax[1], speckwargs={'label':'Rebinned'})
# Using sigma clip to remove bad points from spectrum
# clean_spec Defaults: method='sigmaclip', sigma=3, fit='auto'
spec_clean = spec.clean_spec()
# Cleaned, and Clipped data
spec_clean.plot(fax=ax[2], speckwargs={'label':'Cleaned'})
plt.show()
Total running time of the script: ( 0 minutes 1.802 seconds)